共計 6373 個字符,預計需要花費 16 分鐘才能閱讀完成。
如何利用 Prometheus Operator 實現自定義指標監控,很多新手對此不是很清楚,為了幫助大家解決這個難題,下面丸趣 TV 小編將為大家詳細講解,有這方面需求的人可以來學習下,希望你能有所收獲。
在過去的文章中,我們花了相當大的篇幅來聊關于監控的話題。這是因為當你正在管理 Kubernetes 集群時,一切都會以極快的速度發生變化。因此有一個工具來監控集群的健康狀態和資源指標極為重要。
在 Rancher 2.5 中,我們引入了基于 Prometheus Operator 的新版監控,它可以提供 Prometheus 以及相關監控組件的原生 Kubernetes 部署和管理。Prometheus Operator 可以讓你監控集群節點、Kubernetes 組件和應用程序工作負載的狀態和進程。同時,它還能夠通過 Prometheus 收集的指標來定義告警并且創建自定義儀表盤,通過 Grafana 可以輕松地可視化收集到的指標。
新版本的監控也采用 prometheus-adapter,開發人員可以利用其基于自定義指標和 HPA 擴展他們的工作負載。
我們將探索如何利用 Prometheus Operator 來抓取自定義指標并利用這些指標進行高級工作負載管理。
安裝 Prometheus
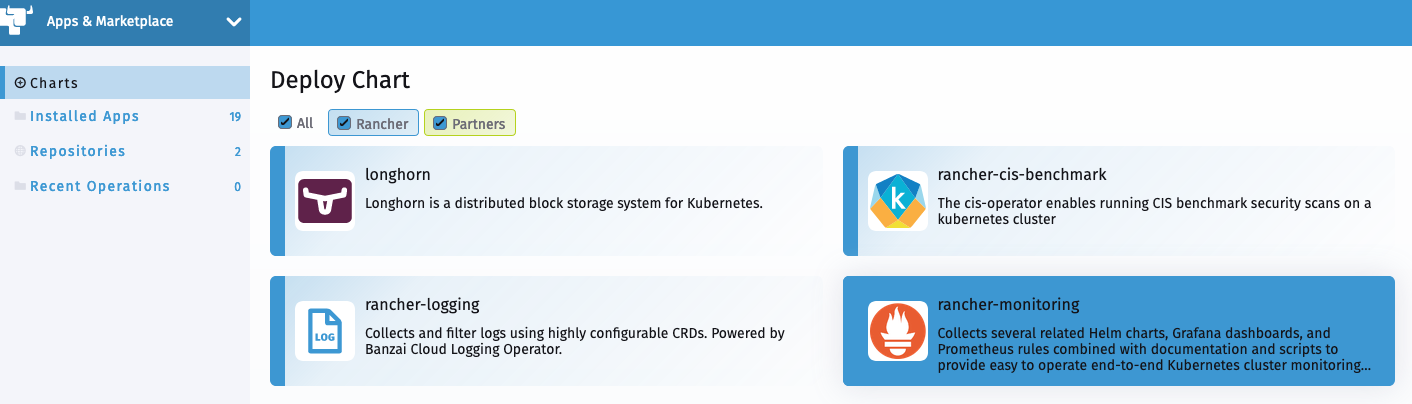
在 Rancher 2.5 中安裝 Prometheus 極為簡單。僅需訪問 Cluster Explorer – Apps 并安裝 rancher-monitoring 即可。
你需要了解以下默認設置:
prometheus-adapter 將會作為 chart 安裝的一部分啟用
ServiceMonitorNamespaceSelector 留為空,允許 Prometheus 在所有命名空間中收集 ServiceMonitors
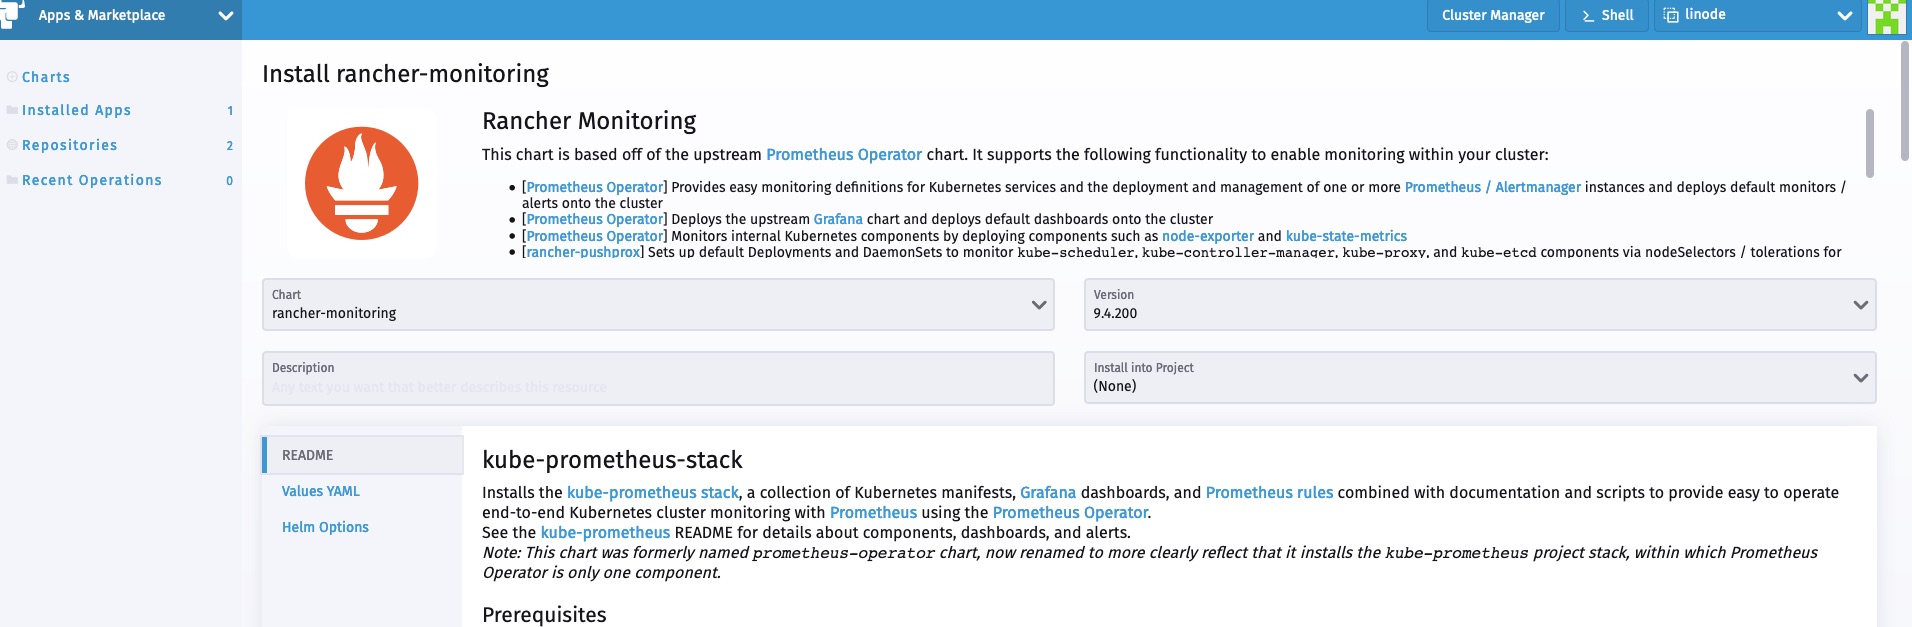
安裝完成后,我們可以從 Cluster Explorer 訪問監控組件。

部署工作負載
現在讓我們部署一個從應用層暴露自定義指標的示例工作負載。該工作負載暴露了一個簡單的應用程序,該應用程序已經使用 Prometheus client_golang 庫進行了檢測,并在 /metric 端點上提供了一些自定義指標。
它有兩個指標:
http_requests_total
http_request_duration_seconds
以下 manifest 部署了工作負載、相關服務以及訪問該工作負載的 ingress:
apiVersion: apps/v1
kind: Deployment
metadata:
 labels:
 app.kubernetes.io/name: prometheus-example-app
 name: prometheus-example-app
spec:
 replicas: 1
 selector:
 matchLabels:
 app.kubernetes.io/name: prometheus-example-app
 template:
 metadata:
 labels:
 app.kubernetes.io/name: prometheus-example-app
 spec:
 containers:
 - name: prometheus-example-app
 image: gmehta3/demo-app:metrics
 ports:
 - name: web
 containerPort: 8080
apiVersion: v1
kind: Service
metadata:
 name: prometheus-example-app
 labels:
 app.kubernetes.io/name: prometheus-example-app
spec:
 selector:
 app.kubernetes.io/name: prometheus-example-app
 ports:
 - protocol: TCP
 port: 8080
 targetPort: 8080
 name: web
apiVersion: networking.k8s.io/v1beta1
kind: Ingress
metadata:
 name: prometheus-example-app
spec:
 rules:
 - host: hpa.demo
 http:
 paths:
 - path: /
 backend:
 serviceName: prometheus-example-app
 servicePort: 8080
部署 ServiceMonitor
ServiceMonitor 是一個自定義資源定義(CRD),可以讓我們聲明性地定義如何監控一組動態服務。
你可以訪問以下鏈接查看完整的 ServiceMonitor 規范:
https://github.com/prometheus-operator/prometheus-operator/blob/master/Documentation/api.md#servicemonitor
現在,我們來部署 ServiceMonitor,Prometheus 用它來收集組成 prometheus-example-app Kubernetes 服務的 pod。
kind: ServiceMonitor
metadata:
name: prometheus-example-app
spec:
selector:
matchLabels:
app.kubernetes.io/name: prometheus-example-app
endpoints:
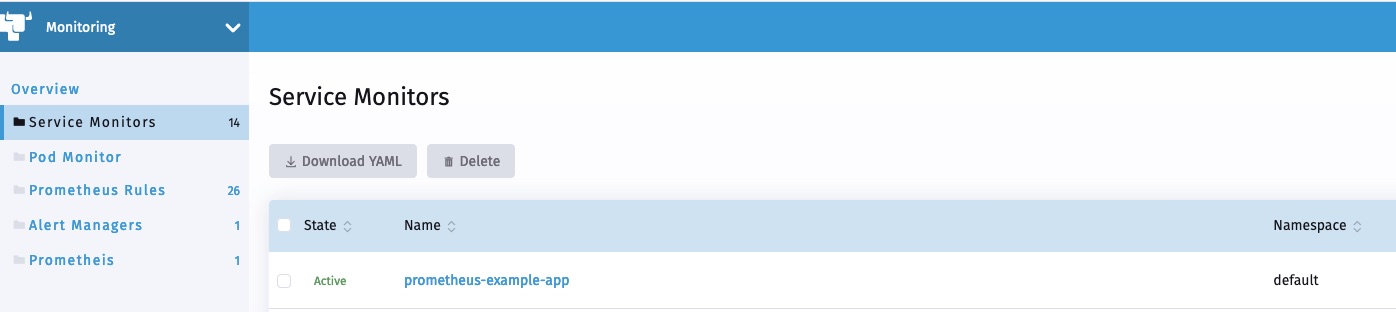
- port: web如你所見,現在用戶可以在 Rancher 監控中瀏覽 ServiceMonitor。
不久之后,新的 service monitor 和服務相關聯的 pod 應該會反映在 Prometheus 服務發現中。
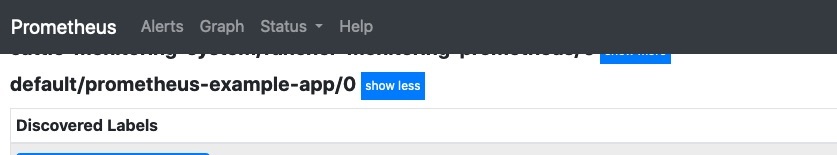
我們也能夠在 Prometheus 中看到指標。

部署 Grafana 儀表盤
在 Rancher 2.5 中,監控可以讓用戶將 Grafana 儀表盤存儲為 cattle-dashboards 命名空間中的 ConfigMaps。
用戶或集群管理員現在可以在這一命名空間中添加更多的儀表盤以擴展 Grafana 的自定義儀表盤。
Dashboard ConfigMap ExampleapiVersion: v1
kind: ConfigMap
metadata:
name: prometheus-example-app-dashboard
namespace: cattle-dashboards
labels:
grafana_dashboard: 1
data:
prometheus-example-app.json: |
{
annotations : {
list : [
{
builtIn : 1,
datasource : -- Grafana -- ,
enable : true,
hide : true,
iconColor : rgba(0, 211, 255, 1) ,
name : Annotations Alerts ,
type : dashboard
}
]
},
editable : true,
gnetId : null,
graphTooltip : 0,
links : [],
panels : [
{ aliasColors : {},
bars : false,
dashLength : 10,
dashes : false,
datasource : null,
fieldConfig : {
defaults : { custom : {}
},
overrides : []
},
fill : 1,
fillGradient : 0,
gridPos : {
h : 9,
w : 12,
x : 0,
y : 0
},
hiddenSeries : false,
id : 2,
legend : {
avg : false,
current : false,
max : false,
min : false,
show : true,
total : false,
values : false
},
lines : true,
linewidth : 1,
nullPointMode : null ,
percentage : false,
pluginVersion : 7.1.5 ,
pointradius : 2,
points : false,
renderer : flot ,
seriesOverrides : [],
spaceLength : 10,
stack : false,
steppedLine : false,
targets : [
{ expr : rate(http_requests_total{code=\ 200\ ,service=\ prometheus-example-app\}[5m]) ,
instant : false,
interval : ,
legendFormat : ,
refId : A
}
],
thresholds : [],
timeFrom : null,
timeRegions : [],
timeShift : null,
title : http_requests_total_200 ,
tooltip : {
shared : true,
sort : 0,
value_type : individual
},
type : graph ,
xaxis : {
buckets : null,
mode : time ,
name : null,
show : true,
values : []
},
yaxes : [
{
format : short ,
label : null,
logBase : 1,
max : null,
min : null,
show : true
},
{
format : short ,
label : null,
logBase : 1,
max : null,
min : null,
show : true
}
],
yaxis : {
align : false,
alignLevel : null
}
},
{ aliasColors : {},
bars : false,
dashLength : 10,
dashes : false,
datasource : null,
description : ,
fieldConfig : {
defaults : { custom : {}
},
overrides : []
},
fill : 1,
fillGradient : 0,
gridPos : {
h : 8,
w : 12,
x : 0,
y : 9
},
hiddenSeries : false,
id : 4,
legend : {
avg : false,
current : false,
max : false,
min : false,
show : true,
total : false,
values : false
},
lines : true,
linewidth : 1,
nullPointMode : null ,
percentage : false,
pluginVersion : 7.1.5 ,
pointradius : 2,
points : false,
renderer : flot ,
seriesOverrides : [],
spaceLength : 10,
stack : false,
steppedLine : false,
targets : [
{ expr : rate(http_requests_total{code!=\ 200\ ,service=\ prometheus-example-app\}[5m]) ,
interval : ,
legendFormat : ,
refId : A
}
],
thresholds : [],
timeFrom : null,
timeRegions : [],
timeShift : null,
title : http_requests_total_not_200 ,
tooltip : {
shared : true,
sort : 0,
value_type : individual
},
type : graph ,
xaxis : {
buckets : null,
mode : time ,
name : null,
show : true,
values : []
},
yaxes : [
{
format : short ,
label : null,
logBase : 1,
max : null,
min : null,
show : true
},
{
format : short ,
label : null,
logBase : 1,
max : null,
min : null,
show : true
}
],
yaxis : {
align : false,
alignLevel : null
}
}
],
schemaVersion : 26,
style : dark ,
tags : [],
templating : { list : []
},
time : {
from : now-15m ,
to : now
},
timepicker : {
refresh_intervals : [
5s ,
10s ,
30s ,
1m ,
5m ,
15m ,
30m ,
1h ,
2h ,
1d
]
},
timezone : ,
title : prometheus example app ,
version : 1
}
現在,用戶應該能夠在 Grafana 中訪問 prometheus example app 的儀表盤。

自定義指標的 HPA
這一部分假設你已經將 prometheus-adapter 作為監控的一部分安裝完畢了。實際上,在默認情況下,監控安裝程序會安裝 prometheus-adapter。
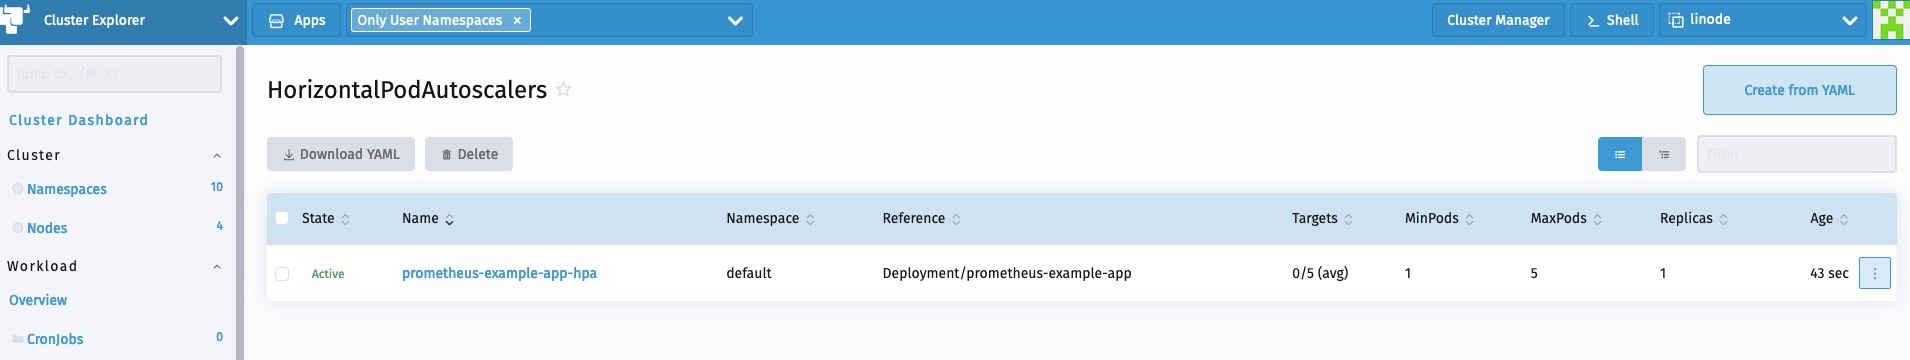
用戶現在可以創建一個 HPA spec,如下所示:
apiVersion: autoscaling/v2beta2
kind: HorizontalPodAutoscaler
metadata:
 name: prometheus-example-app-hpa
spec:
 scaleTargetRef:
 apiVersion: apps/v1
 kind: Deployment
 name: prometheus-example-app
 minReplicas: 1
 maxReplicas: 5
 metrics:
 - type: Object
 object:
 describedObject:
 kind: Service
 name: prometheus-example-app
 metric:
 name: http_requests
 target:
 averageValue:  5
 type: AverageValue
你可以查看以下鏈接獲取關于 HPA 的更多信息:
https://kubernetes.io/docs/tasks/run-application/horizontal-pod-autoscale/
我們將使用自定義的 http_requests_total 指標來執行 pod 自動伸縮。
現在我們可以生成一個樣本負載來查看 HPA 的運行情況。我可以使用 hey 進行同樣的操作。
hey -c 10 -n 5000 http://hpa.demo
開發人員和集群管理員可以利用該堆棧來監控它們的工作負載,部署可視化,并利用 Kubernetes 內可用的高級工作負載管理功能。
看完上述內容是否對您有幫助呢?如果還想對相關知識有進一步的了解或閱讀更多相關文章,請關注丸趣 TV 行業資訊頻道,感謝您對丸趣 TV 的支持。


